Finalizer
Menu
Analyzer
Menu
Timeline
The timeline can show either a standard stereo sample-peak waveform, or a fast Loudness Envelope view. Two buttons next to the timeline allow you to select which timeline to show.
This example below is a typical initial Waveform Timeline view

- The Y-axis is in dBFS
- The X-axis is the track time, in minutes, seconds (milliseconds)
- The top timeline pair has a different vertical scale than the lower pair, and is used for setting the region (see next section below for more details). Click and drag in the top pair, and the Region bounding box will appear.
- Click anywhere on the timeline, and the playhead position will move to that point.
This example below is a typical initial Loudness Envelope Time view

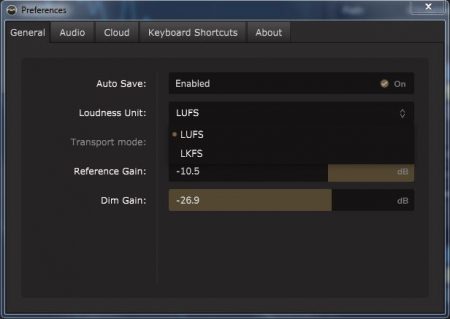
- The Y-axis is in LUFS or LKFS (depending on the Preferences setting).
- The X-axis is the track time in minutes, seconds (milliseconds)
- The top loudness envelope has a different vertical scale than the lower envelope.
- The Preferences/General menu allows selection of the Loudness units, either LUFS or LKFS:


